Last Sunday (3rd March) was a gloriously sunny Spring day. Indeed, it was the sunniest day so far in 2024; see Figure 1 with the red sun rising on the 3rd March.
 |
| Figure 1: Daily Average Solar Radiation (1/1/24 to 7/3/24) |
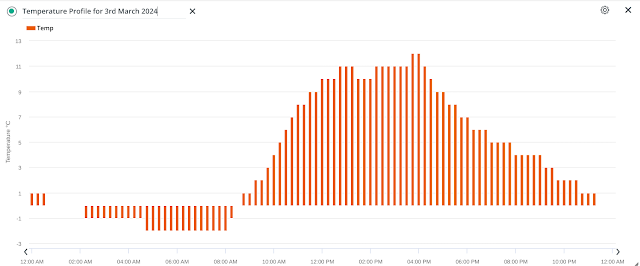
It wasn't especially warm (12 ℃ maximum) - indeed, there have been 18 other days in 2024 that have been warmer - but very acceptable considering the temperature was still 0 ℃ at 8.30 in the morning when I was testing the waters of the River Wye.
 |
| Figure 2: Average Temperature Readings (3/3/24) Recorded Every 15 Minutes |
Fortunately, it was a calm day (Figure 3) ...
 |
| Figure 3: Average & Maximum Wind Speeds (3/3/24) Recorded Every 15 Minutes |
... with mean wind speeds varying between 0 - 3 kilometres per hour (Light Air, Beaufort Scale 1).
If you want to know how warm it feels when you are outside then you need to know the apparent temperature. There are various forms of heat index that take a range of climatic measurements into account when calculating the apparent temperature. The simplest form of heat index combines humidity and temperature values (Figure 4).
 |
| Figure 4: Heat Index Values (3/3/24) Recorded Every 15 Minutes |
For this particular day (3rd March 2024), the heat index profile (Figure 4) mimics the average temperature profile (Figure 2) though there are some small differences if you look carefully (Figure 5). During the afternoon (noon to 4 pm), the apparent (i.e. felt) temperature was typically 1 ℃ lower than the actual temperature.
 |
| Figure 5: Temperatures and Heat Indices (3/3/24) Recorded Every 15 Minutes |
The reason for this was the drop in humidity during this afternoon period (Figure 6) resulting in a cooling effect on the body and a lower apparent temperature. [Note: high humidity restricts the body's ability to perspire which is its main cooling mechanism - this is why hot and humid feels warmer than hot and dry]
Now I'm sure you're thinking: aren't we missing a couple of important climatic factors that will influence how warm we feel? Well, yes, we are. For starters, there is the well-known wind chill factor. As wind speed increases, the rate of evaporation of sweat from the skin also increases and the body cools faster. Whereas the Heat Index considers only temperature and humidity, the THW index also includes the effect of wind speed. For the 3rd March 2024, wind speed was too low to have an appreciable effect on the apparent temperature (Figure 7) so the wind chill (green) and measured temperature (red) values are identical. The drop in humidity during the afternoon (Figure 6) is the reason why the apparent temperature (THW Index, blue) is about 1 ℃ lower than the measured temperature (red).
In the following graph (Figure 8), the measured temperatures (green), Heat Indices (red) and THW Indices (blue) for the 9th January 2024 are plotted. Over the 24 hour period, the air temperature varied from 0 ℃ to 4 ℃. The Heat Index followed the measured temperatures most of the time except when the humidity dropped between 12 am and 2 am and again between 2 pm and 6 pm. During these periods of lower humidity, the Heat Index was 1 ℃ lower than the measured air temperature.
The 9th January was, however, a windy day with average wind speeds varying from 5 km/h to 11 km/h (light breeze, force 2 on the Beaufort Scale); hence the need to include a wind chill factor to calculate the apparent temperature. As shown in Figure 8, apparent temperatures measured by the THW Index were lower by 2 to 4 ℃ compared to the measured temperature.
 |
| Figure 8: Measured and Apparent Temperatures (HI and THW) on 9/1/24 |
Which leads on nicely to the final climatic factor that influences how warm you feel (the apparent temperature). This is, of course, the sun which plays an increasingly prominent role as we leave winter behind and move into Spring and Summer. So far, we have defined apparent temperature (how warm it feels) in terms of Heat Index (based on temperature and humidity) and THW (based on temperature, humidity and wind chill). Unsurprisingly, if we want to include the warming effect of feeling the sun on your face/back, we need a new index: THSW. Figure 9 plots these indices along with the measured temperature for our chosen day: 3rd March 2024. On this particular day, wind chill was negligible so that Heat Index and THW were essentially equivalent.
 |
| Figure 9: Measured Temperature, THW and THSW Index for 3/3/24 |
The large effect of sunshine on the apparent temperature is clearly seen in Figure 9, adding as much as 7 ℃ to the measured temperature on this particular day. Also note that when the sun disappears behind a cloud (13:35 to 13:45 hours), it can suddenly feel cold again.
In summary, temperature and humidity are used to calculate an apparent temperature (Heat Index) which quantifies how warm you feel. The Heat Index can be further modified to take account of wind chill on its own (THW Index) or in combination with the sun's strength (THSW Index). The match up between the indices is not perfect; e.g. in Figure 9, there is a small discrepancy between THW and THSW before sunrise and after sunset when they should, strictly speaking be equivalent.


0 comments:
Post a Comment