 |
| Figure 1: Map of Newton Brook |
We also include the unnamed tributary (Western Stream, source X) of Newton Brook in our surveys. Since this watercourse is, as far as we know, unnamed, we are trying to get it adopted as Maggie's Brook, in recognition of all the work she does.
 |
| Photo 1: Maggie's Brook (unadopted) |
In April 2024, Alan & I surveyed the upper stretch of Newton Brook, Figure 2, sampling and testing at six different sites.
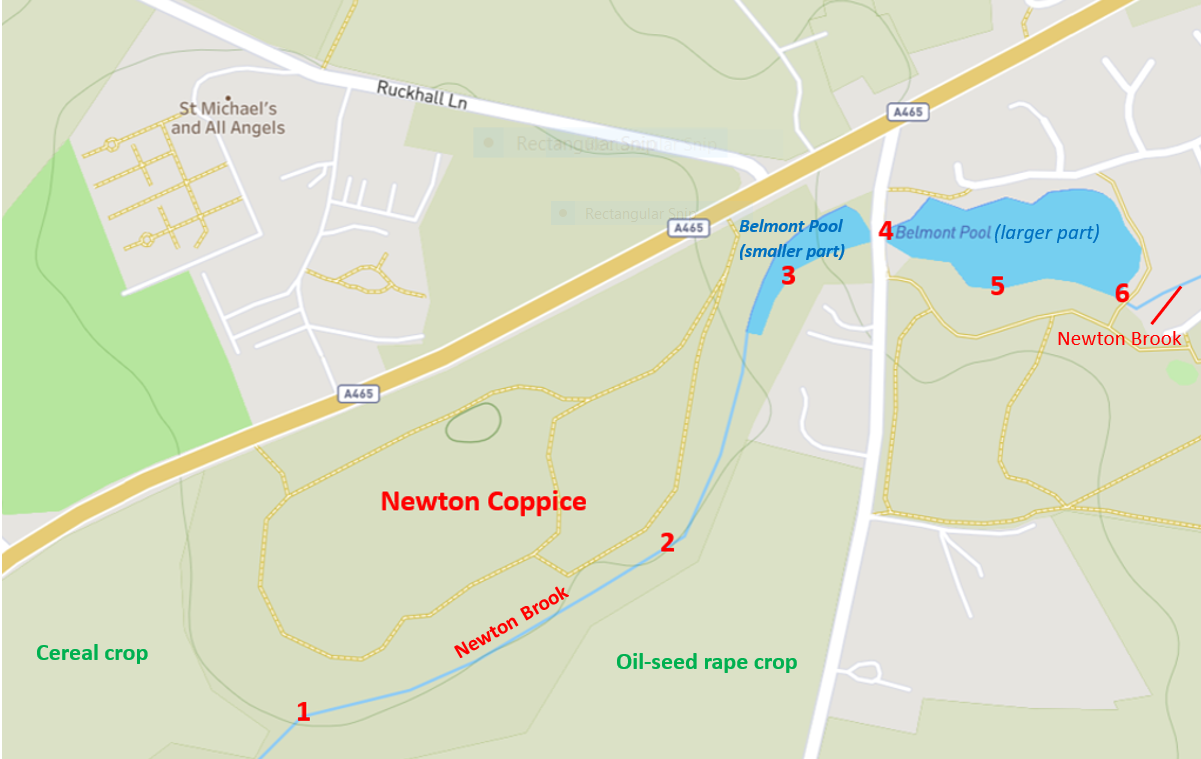 |
| Figure 2: Six Sampling/Test Sites along Newton Brook (21/4/24) |
The purpose of these surveys are two-fold. Firstly, to understand the layout of the land, identify potential sampling sites and pollution sources (agricultural, sewage, road drainage, etc), and note any unmarked water inputs (land drains, etc). Second, to establish seasonal pollutant levels and physical parameters for the entire watercourse. Deviations from baseline pollution levels can be used to identify point source pollution incidents (e.g. leaking septic tank or silage pit) and more general trends of increasing/decreasing pollution.
Table 1 presents a summary of the on-site chemical analyses performed during this particular survey.
As noted in the schematic below, courtesy of Freshwater Habitats Trust, pollution levels are very low for phophate yet very high for nitrate.
 |
| Figure 3: Schematic of Relative Pollution Levels for Phosphat and Nitrate (h/t Clean Water for Wildlife) |
At Site 3 (Figure 2 & Table 1), the water turbidity was high and there was a very obvious algal bloom event (Photo 2 & Photo 3).
 |
| Photo 2: Algal Bloom at Site 3 |
 |
| Photo 3: Closeup of Algal Bloom at Site 3 |
Fortunately, these are filamentous algae. Unsightly but not dangerous.


0 comments:
Post a Comment